📊 Grafana Setup for Monitoring Stack
This guide explains how to configure Grafana to visualize data from your monitoring stack:
- Set up the Prometheus datasource
- Import dashboards from Grafana Labs
- Import a custom SD card monitoring dashboard from JSON
✅ Grafana may run outside this stack, but must have access Prometheus via
http://<host>:9090.
🔗 1. Add Prometheus Data Source
-
Open Grafana in your browser:
http://<your-grafana-host>:3000 -
Log in (default is
admin / adminunless changed) -
In the left menu, go to:
⚙️ → Data Sources → Add data source -
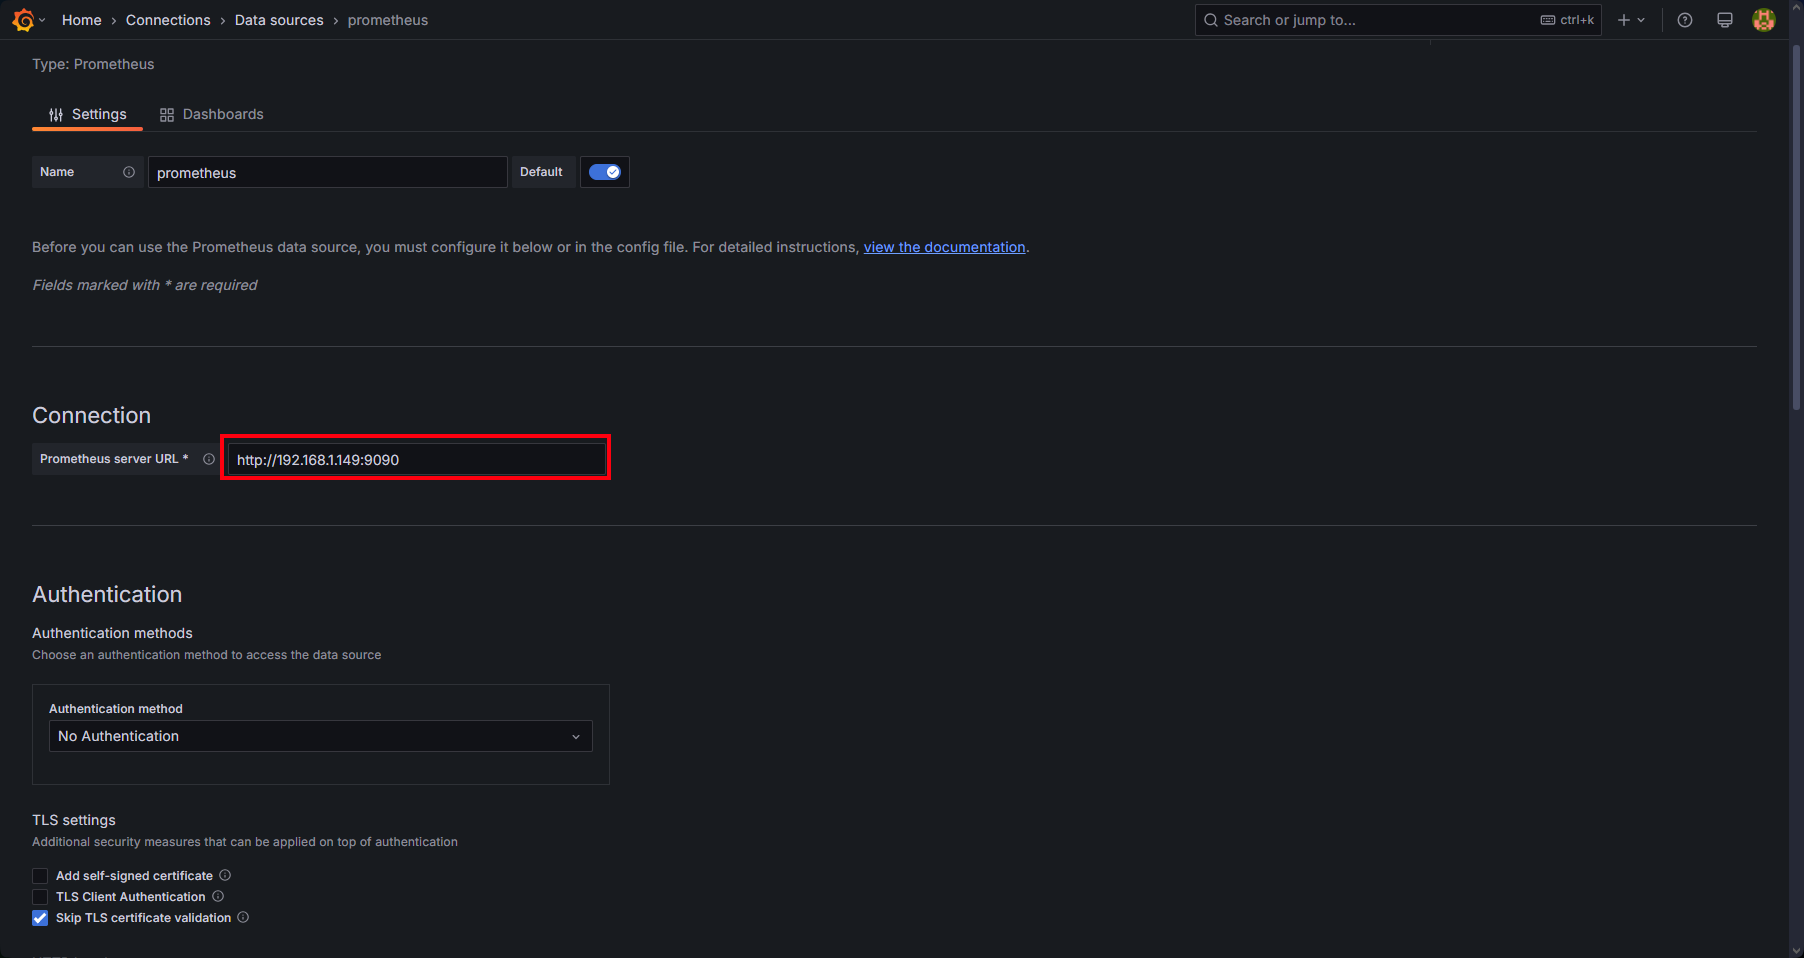
Select Prometheus
-
Set the URL to:
http://<your-docker-host>:9090
- Click Save & Test
📥 2. Import Dashboards from Grafana Labs
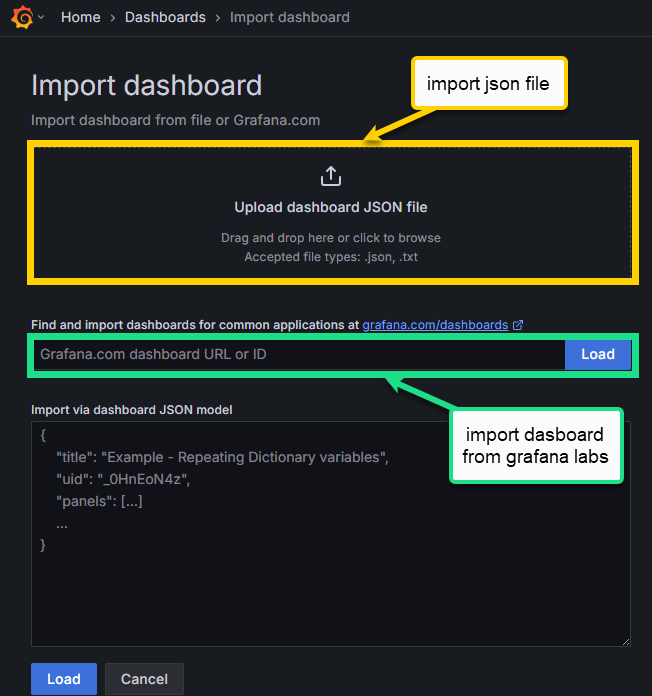
How to Import a Dashboard by ID:
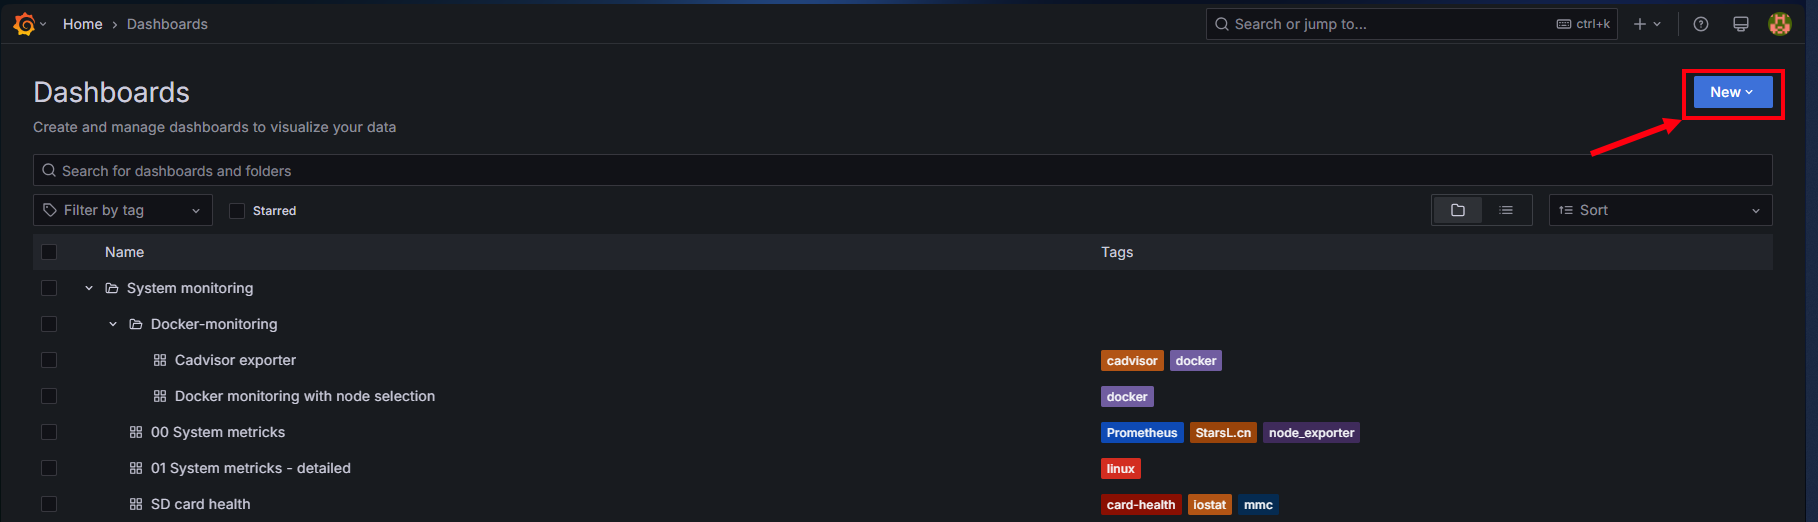
- In Grafana, go to + (Create) → Import
- Enter the dashboard ID (from the list below)
- Click Load
- Choose your Prometheus datasource
- Click Import
Recommended Dashboard IDs:
| Dashboard Name | Grafana Labs ID |
|---|---|
| Node Exporter Full | 1860 |
| Docker Monitoring (cAdvisor) | 11074 |
| Prometheus 2.0 Stats | 4282 |
| Host Resource Usage (Node) | 8321 |
These dashboards provide detailed insights into your system, containers, and Prometheus itself.
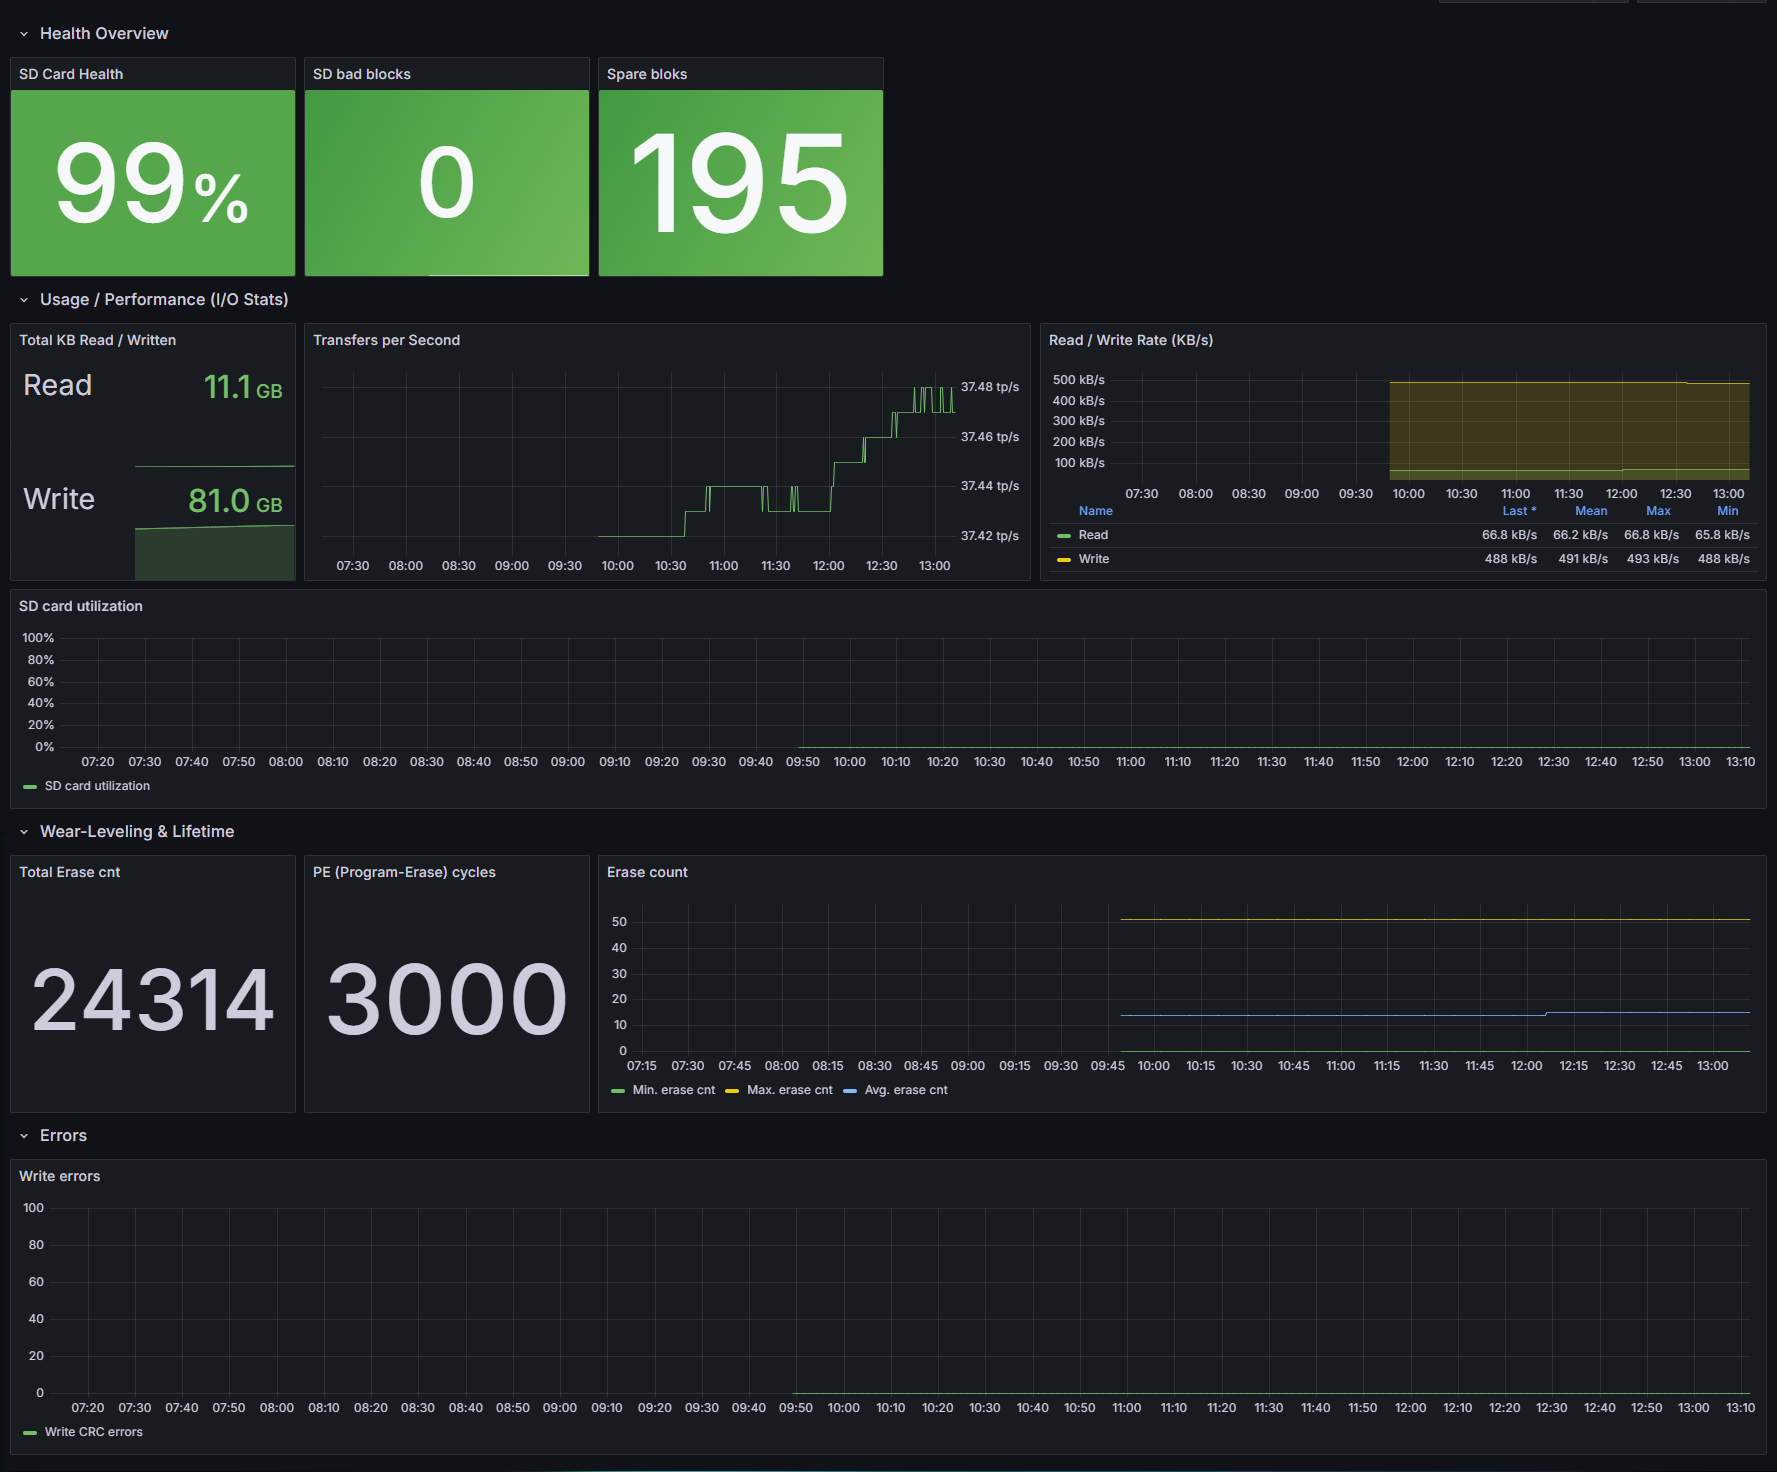
📁 3. Import SD Card Monitoring Dashboard (from JSON)
You can use the included grafana-dashboard.json file to visualize metrics from the sdcard-exporter.
To Import:
-
Go to + (Create) → Import
-
Click Upload JSON file
-
Select the file: Monitoring/SDcardHealth/grafana-dashboard.json
-
Choose your Prometheus datasource
-
Click Import
✅ Result
You should now have a Grafana dashboard suite with:
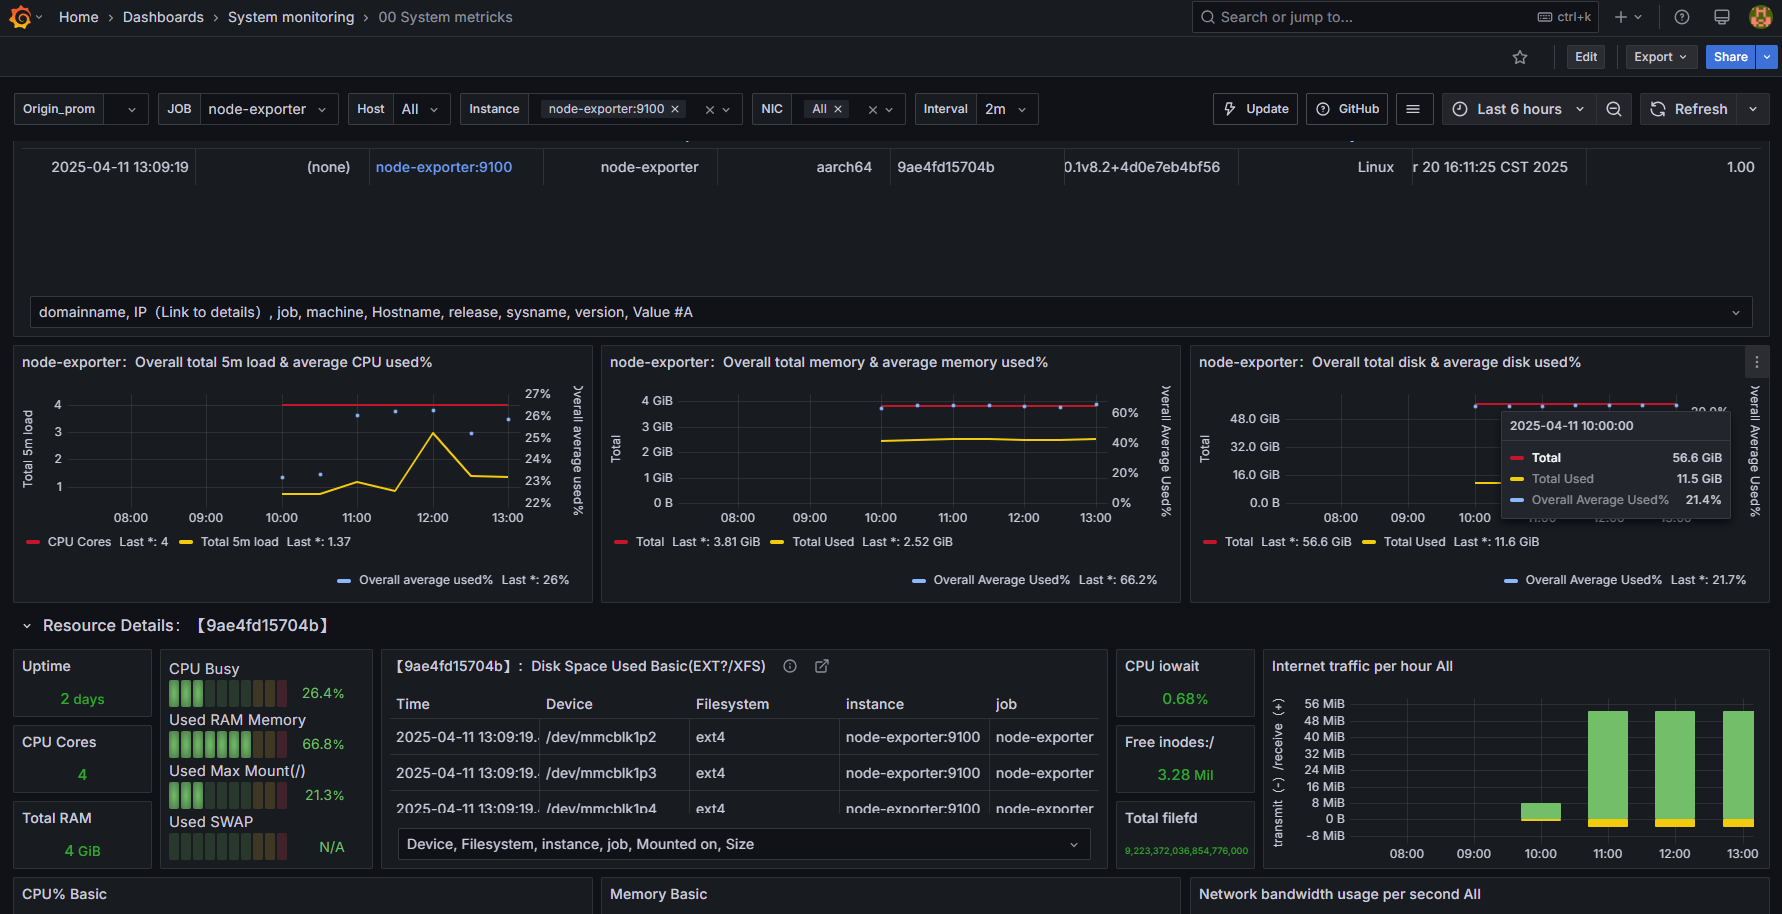
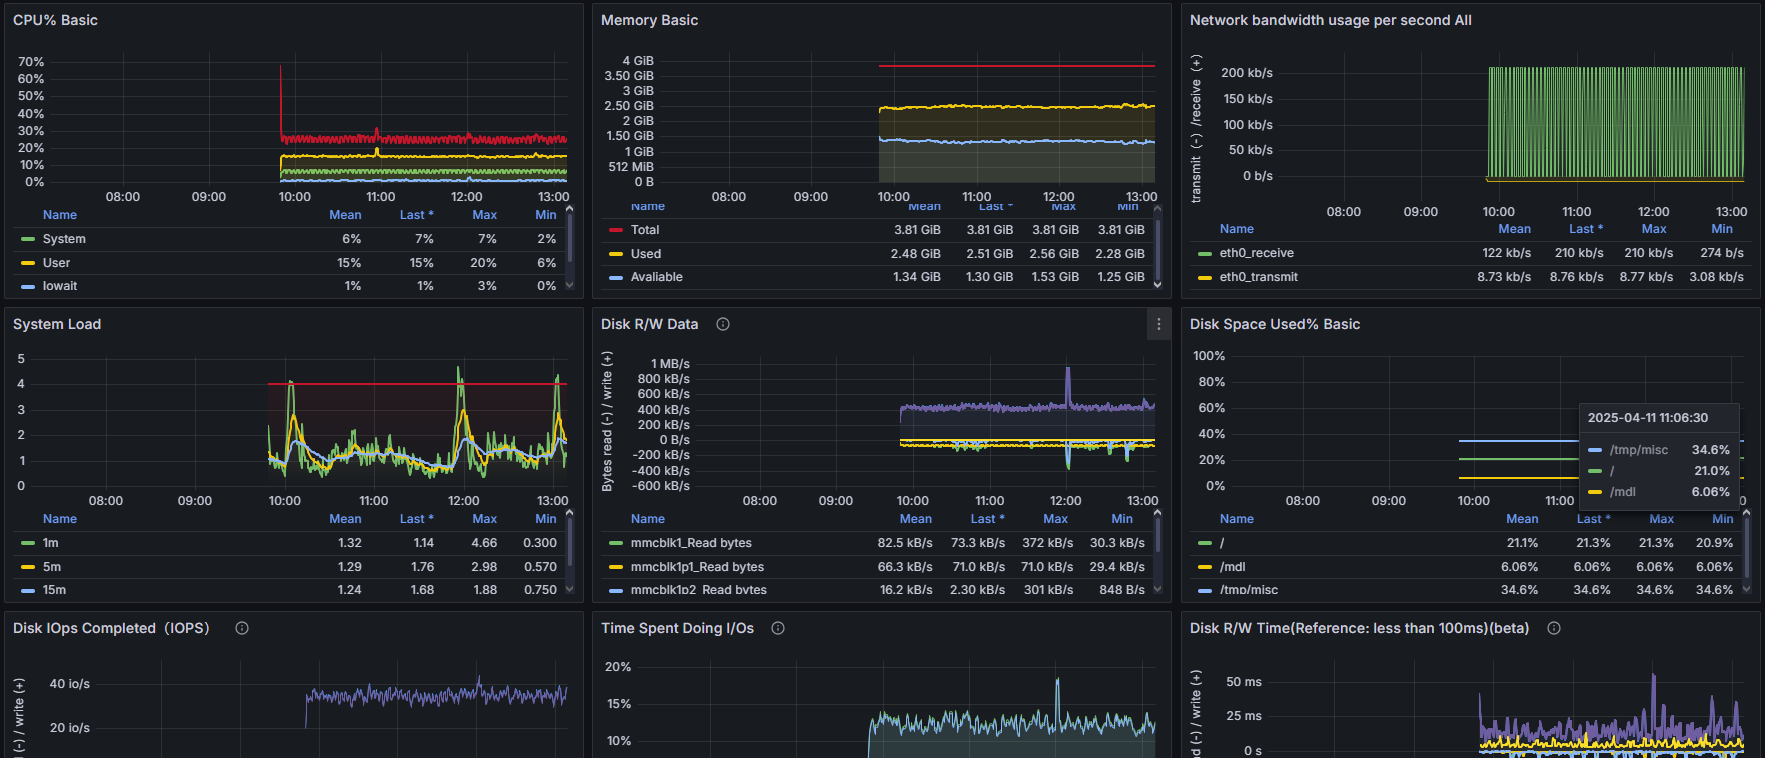
- System-level stats (Node Exporter)
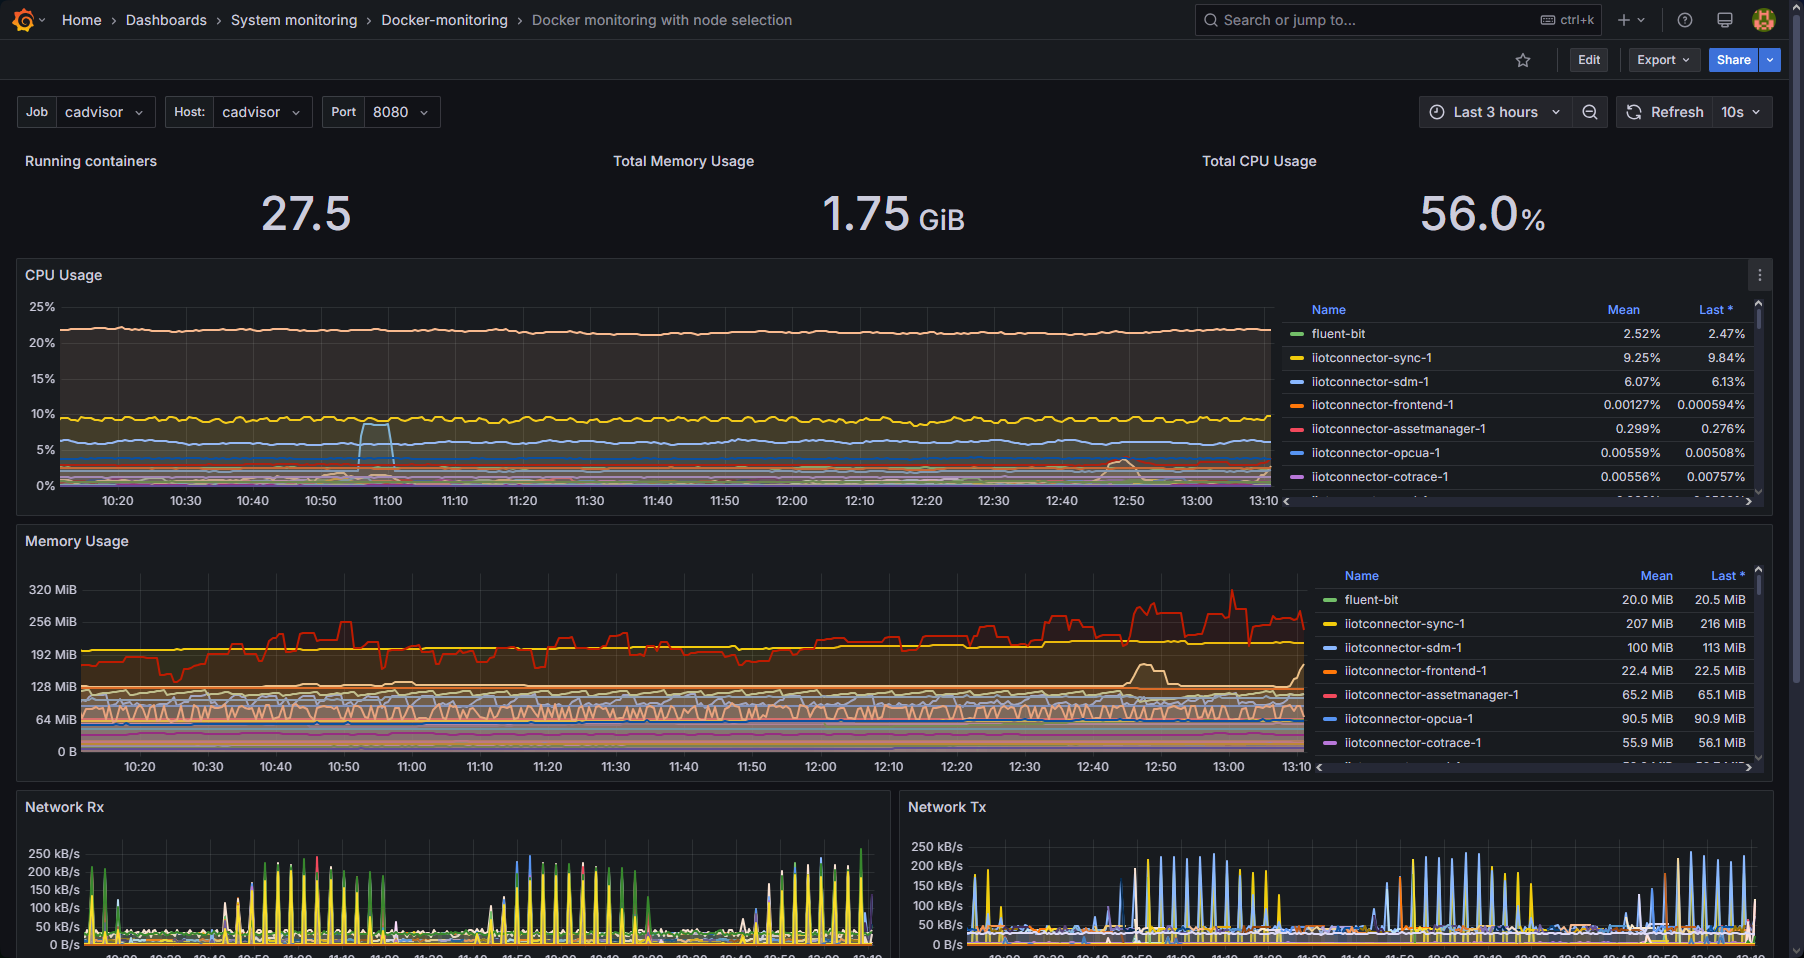
- Docker/container metrics (cAdvisor)
- Prometheus internal metrics
- SD card health stats from your custom exporter
You can now customize alerts, panels, and create a full monitoring UI.
🧩 Tips
- To make dashboards dynamic, use variables like
instanceorjobin panel queries. - You can set refresh intervals and time ranges at the top right of each dashboard.
- Exported dashboards can be versioned with Git for easy updates.